Digital Realty US
We are here to serve all of your real estate needs!
LISTINGS
RECENTLY SOLD
Get Your Home Valuation Report For Free!
Find your home's value in today's market!
MY BLOGS
The Mortgage Market: Rising Rates and Evolving Trends
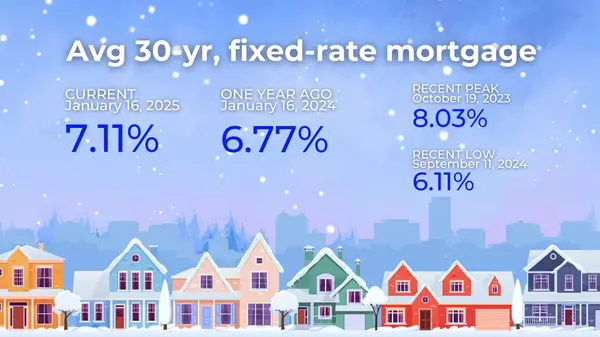
Mortgage rates and bond yields have surged through October and early November, presenting new challenges for prospective buyers and signaling shifts in the housing market’s recovery path. The Federal Reserve's recent rate cuts haven’t curbed rising mortgage rates—in fact, rates have jumped nearly a full percentage point since the Fed’s first cut on September 18, quashing early signs of recovery in existing home sales. What the Fed Futures Market Tells Us Looking ahead, the Fed futures market offers insights into potential rate cuts: December 18, 2024: The market is pricing a 66% probability of another 25 basis points (bps) cut, bringing the Fed Funds Rate range to 4.25–4.50%. January 29, 2025: There's a 51% chance that rates will remain steady. However, a further 25 bps cut could drop the rate range to 4.00–4.25%. With rate cuts on the horizon, mortgage rates may begin to stabilize, but the market’s uncertainty is evident, as future rate cuts remain far from guaranteed. Expert Insights on the Market Outlook Lawrence Yun, NAR’s Chief Economist: Yun forecasts a gradual rise in existing home sales, moving from 4.47 million in 2025 to over 5 million in 2026. Price appreciation, however, is expected to slow, aligning more closely with the consumer price index as new housing supply enters the market. Brian D. Luke, Head of Commodities, Real & Digital Assets: Luke highlights that home price appreciation has been cooling, showing its slowest annual growth since mortgage rates peaked in 2023. Even as prices decelerate, the market reached new all-time highs for the 15th consecutive month, adjusted for seasonality, but the long-term trend suggests more modest growth. Key Takeaways for Buyers and Sellers Higher Mortgage Costs: Rising mortgage rates mean higher borrowing costs, impacting affordability for buyers. Slower Price Appreciation: With decelerating price growth, buyers may find fewer bidding wars, while sellers will need to price competitively. Inventory Expansion: Increasing supply could offer more options for buyers, helping to balance the market. As rates continue to shift, a watchful eye on Fed decisions and mortgage trends will be crucial for those navigating the housing market. Whether planning to buy or sell, staying informed and adaptable will be key in the evolving landscape.
MOREA Closer Look at Housing Inventory: October Trends from Realtor.com’s Database
A Closer Look at Housing Inventory: October Trends from Realtor.com’s Database
Hi, I’m Billy Abildgaard, broker and owner of Digital Realty US. When it comes to understanding market dynamics, tracking inventory data is key. Realtor.com’s latest residential listing database offers a comprehensive snapshot of active inventory levels across the U.S., right down to metro and ZIP code areas. Here’s what the October data tells us about current inventory trends—and what they mean for buyers, sellers, and the overall market. Rising Inventory Levels: Approaching Pre-Pandemic Norms In October, active inventory rose 1.4% month-over-month to 953,814 homes, marking the highest inventory level since December 2019. This increase indicates that the market is beginning to balance out as we move closer to pre-pandemic levels. Six Key Takeaways from October’s Inventory Data Inventory Concentration in Three States. Over one-third of active listings in October were in Florida (15.2%), Texas (12.2%), and California (6.5%). These states' shares of active listings are interesting when compared to their population sizes. For instance, Florida's 6.6% share of the U.S. population is much lower than its 15.2% share of active listings, indicating a disproportionate number of homes for sale in the state. California, on the other hand, has a larger population (11.7%) but a smaller share of active listings (6.5%). High New Listing Rates in Florida, Texas, and California. Roughly 28% of all new listings in October were concentrated in Florida (11.0%), Texas (9.3%), and California (7.9%). This distribution reflects these states' appeal to both buyers and sellers, especially Florida, which continues to see high listing volumes. Seven States Surpass Pre-Pandemic Inventory Levels. Seven states—Tennessee, Texas, Arizona, Florida, Colorado, Idaho, and Utah—currently have active inventory levels above those seen in October 2019. Tennessee leads with a 14% increase, closely followed by Texas with 13% and Arizona with 11%. This rise suggests that supply in these regions is catching up with demand, creating potential opportunities for buyers. Declines in Median Listing Prices. October saw median listing price drops in several states, with Florida down by -6.9%, Hawaii by -6.1%, and Iowa by -4.9%. This trend may be a response to shifting buyer demand and evolving economic conditions, giving buyers a chance to find better value in these areas. Notable Price Drops in Major Metros. Within the Top 100 metro areas, Miami (-12.3%), Honolulu (-11.4%), and San Francisco (-9.2%) saw some of the largest year-over-year declines in median listing prices. This shift, particularly in high-cost metros, suggests an easing in price growth in previously overheated markets. Significant Listing Price Growth in Smaller Markets. Cities like Toledo (+20.2%), Syracuse (+14.5%), and Rochester (+11.0%) led the way in year-over-year price growth. These cities are seeing strong demand and appreciation, possibly due to their relative affordability compared to larger metros. The New England Market: Limited Inventory Despite Strong Price Growth Interestingly, New England states like New Hampshire, Maine, and Vermont show that even with a notable 70–75% increase in home prices since 2019, inventory levels remain 45–55% below pre-pandemic levels. This scarcity highlights the region’s strong demand and constrained supply, creating an especially competitive market environment. Final Thoughts The October inventory data offers a nuanced view of today’s housing landscape. From inventory-rich areas like Florida to highly competitive markets in New England, the trends emphasize the importance of a localized approach to buying and selling. Understanding these shifts is key for making informed real estate decisions in a market that’s continuously evolving.
MORECase-Shiller Report: Key Trends in National and Big-City Home Prices
Case-Shiller Report: Key Trends in National and Big-City Home Prices
The latest Case-Shiller Home Price Index offers us valuable insights into the national and big-city housing markets, where trends have been marked by both resilience and notable regional variations. Here’s what the data tells us about the state of U.S. home prices and what it means for homeowners and buyers alike. A Snapshot of August’s Price Growth In August, the seasonally-adjusted (SA) national Case-Shiller index showed a 0.3% increase in home prices month-over-month, up from roughly 0.1% in the two prior months. Despite this slight reacceleration, year-over-year price growth has slowed, dipping to 4.2% from 4.8% in July and 5.4% in June. These changes indicate a steady but cooling pace in the market, offering some stability compared to the rapid price increases of the past few years. Key Takeaways from the National and Big-City Indexes Steady National Price Appreciation. Year-to-date, the national SA index is up 2.4%, translating to an estimated 3.6% annualized home price appreciation rate for 2024. While this figure may seem modest compared to the unprecedented appreciation rates of 2020 and 2021, consider this: a 3.6% increase on a $400,000 home translates to an equity gain of around $14,000, which is still substantial for homeowners. Big Cities Lead in Recovery. The Composite 20 index, which tracks major metro areas, has outpaced the national index for seven consecutive months. Cities such as New York and Seattle are experiencing strong price rebounds, while markets like Detroit and Chicago are also showing sustained growth. This trend suggests that big-city markets are stabilizing and even thriving, driven by demand and urban renewal efforts. Price Declines in Limited Markets. In August, only Miami and Tampa showed minor month-over-month price declines among the big cities. Phoenix and Tampa were the only markets with year-to-date declines, with Phoenix seeing a -1.0% drop and Tampa a -0.4% dip. These isolated declines emphasize the importance of local market dynamics in influencing broader trends. Phoenix’s Unique Price Adjustment. Phoenix has seen declines in five of the last six months, suggesting a localized market correction. This may be linked to higher inventory levels, a shift in buyer demand, or unique regional factors, highlighting the need for buyers and sellers to stay informed about local conditions. Las Vegas Reaches New Price Peak. After a 26-month period from peak to trough to new peak, Las Vegas has finally exceeded its mid-2022 home price high. Only six major cities remain below their mid-2022 peaks: San Francisco, Phoenix, Denver, Portland, Seattle, and Dallas. This progress in Las Vegas indicates a slow but steady recovery for markets impacted by previous declines. Why the Case-Shiller Index Matters The Case-Shiller Index is widely regarded as one of the most accurate measures of true home price appreciation because it uses a repeat sales method. This method tracks price changes based on the same property’s sales over time, minimizing the distortion that can result from shifts in the types of homes being sold. Unlike measures that rely on median sale prices, the Case-Shiller data offers a clearer picture of actual market appreciation. What This Means for Buyers and Sellers For homeowners, the steady 3.6% appreciation rate nationally can provide a sense of stability and continued equity growth. For prospective buyers, the cooling in year-over-year growth could signal more manageable price conditions, though regional variations remain important to consider. Buyers should keep an eye on local trends, especially in markets like Phoenix and Tampa, which are showing slight downward adjustments, as well as recovering cities like Las Vegas. Final Thoughts As the market continues to adjust from the highs of recent years, the Case-Shiller report offers valuable insights for navigating these shifts. Whether you're considering buying, selling, or simply staying informed, understanding these trends can help you make informed real estate decisions.
MORE